5 Ways to Leverage Data to Increase Revenue
Data is becoming an increasingly central aspect of the decision making process. Providing quantitative reasoning, data empowers businesses to make smarter decisions.
Leverage Data to Make Better Business Decisions
According to a study from MIT Center for Digital Business, enterprises that are data-driven had 4% higher productivity and 6% higher profits than the average. It’s important for large multi-location businesses and independent operators alike to leverage data to extract business insights and turn those insights into profits.
Data is becoming increasingly accessible as technology plays a larger role in our processes and operations. Likewise, it is becoming increasingly easier to understand and analyze. Restaurants and retailers have the opportunity to leverage data from their modern point of sale (POS) platform and management tools and use that data to set their business apart. Take a look at five types of data to utilize in your decision making.
Use Sales Data to Enhance Operations
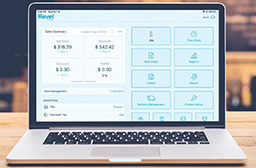
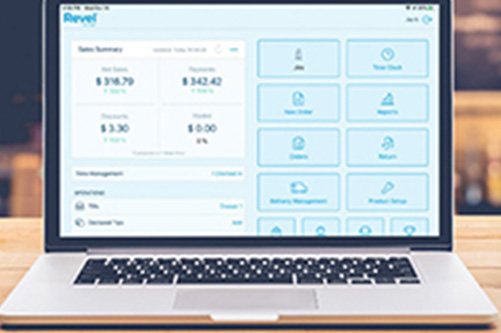
Business owner at laptop
Sales data provides the hard performance numbers and key trends as it is collected over time. This enables you to answer questions like – What is our monthly revenue? How many of each item are we selling per week? How much money are we bringing in each day, are we hitting our goals? And the longer term questions like, how much revenue did we bring in last year?
Beyond answering those and other key questions, your sales data enables businesses to analyze and plan with increased accuracy. Using a POS that tracks sales information over time, provides decision makers with the opportunity to look at that historical data and make the right moves.
Let’s say, for example, it is clear from your data that Sundays are consistently your slowest day of the week- and have been for a number for months. You can take that information and make adjustments to your operations such as increasing marketing, offering a promotion to get more customers in the doors on Sundays, or even decide to limit hours on Sunday. Whatever the decision may be, your data provided a clear picture, indicating that if you want to see different numbers, there should be action taken.
Don Ho – Social Summer Kitchen
Singapore
Don Ho, a restaurant bringing tropical drinks and fare to Singapore, knows about the importance of leveraging sales data to benefit business. The management team regularly evaluates menu items to guide future decisions. To do this, the team looks at the sales performance of individual menu items, “You can actually break it down to items, so you can see, “Okay, which items were the best sellers? What sold? What didn’t sell?” And then we can just like analyze it, you see the voids, you can ask, “What’s wrong?”
Track Labor Performance and Needs
Restaurant owners review data
Employee reports provide detailed insight into how your team impacts the business. Labor reports can provide information on your labor spend in a given period of time. And, they can indicate who your highest performing employees are, enabling you to better forecast your needs.
Additionally, linking performance and holding employees accountable based on data provides a clear and fair process for rewards and discipline. A POS platform, like Revel, ties every purchase to the employee who was working at the terminal. This provides a clear tie between sales and individuals. If your business if commission based, it is now easier than ever to ensure you are properly compensating your team for the effort they are putting in.
While you may use the same number of employees for every shift, comparing your employee data to your sales data can help you identify your real staffing needs:
Evaluating your sales data over a year may likely show you that you bring in less revenue during the summer months. This also indicates that you don’t have the same staffing needs.
A retail shop may find that business is booming in the holiday months. That shop can take that data and realize that they need an additional employee to best accommodate all shoppers.
Gen Korean
California
Technology plays a big role in Gen Korean’s operations. The brand uses robots to deliver dishes to diners through robust business reporting. They also understand how important data can be in making the right decisions. One such way is in how David manages his staff. “The function that we use the most is checking the up-to-date labor. And that’s very important to use because if we have too many people on the clock, then we’re not being efficient with our resources.”
Maximize Inventory with Inventory Data
Product mix
How are your inventory levels? Which items are the fastest movers? Do you have the right amount of ingredients to last until the next delivery? Inventory reporting data helps you answer these critical questions. To ensure you have the items your customers really want, you need to make sure you’re buying the right items. Inventory analytics can quickly show you which items are moving and which aren’t.
The most effective inventory management tools integrate directly into the point of sale to seamlessly update inventory levels as sales are made. Reducing the manual aspect of inventory management, integrated inventory management also reduces errors associated with manual processes.
In order to properly leverage inventory data, it is important to –
Start with clear organization – your inventory structure should be easy to understand
- Set up a monitoring schedule – depending on volume could be daily, weekly
- Analyze for trends – best sellers, slow movers, seasonal items
- Make decisions based on those trends – adjustments to purchase orders
- Setting up a process is important in keeping yourself accountable.
This also applies to building out a strong foundation for data. And with that foundation, you’ll reduce the challenges you may have faced in managing inventory.
Keep Up with Your Customers
If your POS platform has a customer relationship management (CRM) system that captures your customers’ contact information and order history, you can track guest behavior. Use customer reports to identify customers who visited your restaurant the most or spent the most amount of money. Then, send them a targeted email as thanks. Do a deep dive into individual customers. You can view detailed information like their average check, days since their last visit, and most frequently ordered items. This information will help you learn more about the guest experience at your restaurant.
Gregoire
California
Gregoire Restaurant provides high-end French food for takeout in both Berkeley and Oakland, California. Gregoire Jacquet studied cooking in France and worked in the high-end restaurant industry for many years. Once he felt ready to open his own business, he and his wife opened their first Gregoire Restaurant in Berkeley in 2002. Four years later, after growing demand, Jacquet opened a second location in Oakland and has scaled with the Revel iPad Point of Sale system.“I discovered I have 37% repeat customer in my business and that, for me, is amazing to know.”
Tying Your Data Together
Since data doesn’t exist in a silo, we’re going to circle back to sales data again. Your sales and revenue are the lifeblood of your business. Therefore, it is important to look at how to analyze your sales data against other business analytics for a full picture of business health.
Common methods for analyzing data:
- Hourly sales reports analyzed with hourly labor reports, for example, provide a clear view of the amount of money coming in and the money “going out” to labor. You may find that you’re comfortable with the ratio during most of the day, but identify a slow hour or two that could use one less cashier or server.
- Looking at your sales data together with your inventory levels provides a holistic view of your daily and weekly sale, while also enabling you to pull out insights like your top selling items and the seasonality of various products.
Individually, each of these reports provides select bits of information you should be monitoring. But together, they paint a picture of the overall health of your business. If your business is not regularly tracking data in these areas, you are missing out on the opportunity to truly understand your business. Revel helps operators take the guesswork out of decisions by combining a full reporting suite into an easy-to-analyze dashboard.
As you track performance across these areas, you’ll begin to identify trends. It then becomes possible to take the guesswork out of growth and minimize risk with data-driven decisions. With regular analysis, you can see where you should invest your time and money in order to grow your business.
Sajj
California
Sajj, a healthy and fresh Mediterranean quick service concept with locations in the Bay Area, relies on multiple types of data to guide the business. With Revel’s integrated reporting system, Sajj is making the right decisions to continue growth. “The fact that the data is available all the time is really a priceless activity. For us, it’s very important to know how we’re doing, how the staff is doing, when the customers are coming in, and how much customers are enjoying the experience; reports are really the one thing that helped us the most.”
Final Thoughts
With Revel, you have all of the data you need at your fingertips. The management console is your business command center. It features a robust reporting dashboard that automatically maintains a clear view of your operations. View real-time sales data, inventory, customer data, employee insights, and more! With over 40 reports, operators can efficiently view high-level performance insights through granular data. Want to learn more about Revel’s Reporting capabilities? Get a Demo with one of our product experts.