Intro to Reporting and Analytics
From ordering the right amount of inventory to understanding who your loyal customers are, learn how you can use POS reporting features to better understand your business.

1. Intro to Restaurant Reporting
“75% of operators that received weekly food and labor costs were profitable vs. of those without weekly reports had a lower percentage of 60%.
-(Source: restaurantowner.com)
Let’s start with the basics, what is a report?
A report collects together important information and makes that information easy to understand. Ultimately, the purpose of a report is to provide concrete data to help you make informed business decisions.
Reporting for restaurants
For restaurants specifically, reports can make a big impact on operations and your bottom-line. Evaluating reporting data can assist you with everything from figuring out your employee scheduling requirements to ordering ideal levels of products and inventory.
Both of the examples above provide actionable areas for restaurant owners to improve efficiency and get smarter with their spending by leveraging reports. Let’s deep dive into the types of reports you should be using.
2. Types of Reports
Sales Reports
Think of this as a main ingredient of your business, you should regularly analyze your sales reports. As indicated by the title, sales reports provide you with a picture of your sales numbers, there are multiple ways to evaluate your sales:
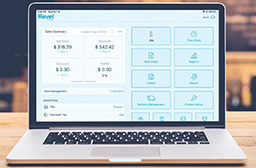
Sales Overview – This provides you with a high-level overview of your daily sales. Use this to understand total volume of product going out, and dollars coming in.
Product Mix – Utilize mix reports to understand which products or items are your best sellers. A product mix report will show you a visual break down of your top sellers, bottom sellers, and everything in between.
Hourly Sales – Interested in learning how much you are selling during the lunch rush? Make use of hourly sales reports to understand which hours are your busiest and which are slow. With this information, you can make important decisions like adding another staff member during busy rushes.
Order History Reports
Order History reports display all orders taken in a given time frame. This report allows you to see a brief overview of each order taken, including when the order was created, when it was closed, the employee that processed the transaction, the sales generated, and the payments collected for those sales.
There are a few important uses for these report:
- Use this report to understand how long transactions take. This report provides data on the open and close time of each order, which can be useful when training new employees or when trying to reduce lines.
- This report can also help you identify your busiest times of the day.
Inventory
An inventory report is a summary of items belonging to a business. It provides a comprehensive account of the stock or supply of various items. A good inventory report should always be clear, simple, and comprehensive – providing you a view of your inventory levels in a clear manner.
Additionally, an inventory report helps you measure inventory turnover and average days to sell inventory, which helps with forecasting your inventory ordering schedule. Identifying trends and patterns can take the guesswork out of the ordering process.
To ensure effective inventory reports, your inventory management should be well organized. To learn more about inventory management best practices, take a look at Revel’s
Employees, Payroll, & Scheduling
Payroll Summary Reports provide a quick way to see the payroll totals by employee for a specific period of time. This report shows the payroll items with a subtotal for net pay, plus all the company payroll taxes are shown by employee.
Employee Timecard Reports show up-to-date records on employee time cards to keep an eye on your team’s activity. Along with activity, timecard reports can provide a look at your labor spend.
Employee Profit Reports provide a look at the revenue each of your employees brings in. This is a good way to keep an eye on productivity and for commission based roles, quickly and accurately measure your commission payouts.
Go Beyond Based on Your Business
The reports above are key reports you should be analyzing, but also consider additional reports based on programs and activities you engage:
- Gift Card Report This report displays all gift cards, current points, and linked customers. You can also modify the gift card balances.
- The Discounts Report houses all item discounts, orders discounts, exchange discounts, and coupon transactions made on the Point of Sale.
- Exception Reports show you voids, refunds, and gift card covered purchases over a certain period of time. This can be helpful if there are discrepancies across your other reports, and may also point to employees that need additional training.
Handle Reporting in a Single Platform
Do all of these reports sound like a lot to manage? Many systems have created an overview that combines multiple reports into one.
With Revel, the Operations Report is a combination of various reports all rolled into one. Instead of going opening and analyzing each individual report separately, this reconciles the essentials from each report into one large report – giving you a full picture of your business’ performance.
3. Tips to Make Reporting a Breeze
Make sure you can act on the information in a report. With the availability of so many types of reports, it is important to focus on the reports that will help you run your business more efficiently.
Keep information in reports to a realistic minimum. On that same note, too much data can be a time drain. While you want a full picture of your business, you need the right data.
- Use high-quality data.
- Present information in the right way.
- Don’t try to make one report do everything.
- Decide how frequently you’re going to report.
Get a daily view of operations. With various types of reporting, comes a lot of data, and analyzing too many numbers can be counterproductive. So keep up with your data and view the important numbers more often.
Keep an eye out for patterns and sales cycles
One powerful way to use your reports is to analyze reporting data for patterns. For example, by monitoring sales data for an extended period of time a restaurant may learn that Fridays are the best seller of fried food, with that information, they can make changes to make sure there is enough inventory.
Benchmark performance metrics
Whether you are comparing one location against another, certain days against other days – by setting benchmarks, you can have concrete measures of success to compare against. To understand your benchmark metrics, you should identify areas of importance, which brings us to four.
4. Reports for Decision Making
The goal is to turn data into information, and information into insight.
– Carly Fiorina, former CEO of HP
Let’s use those reports to improve your business! To do this, you will need to outline goals and expectations for areas of your business. A standard method for measuring and acting on reports is by using KPIs.
Key performance indicators (KPIs)
What they are: These are the data points you track that tell you what’s going on in your business. Each of your KPIs should follow:
- Key — Essential to understanding what’s going on.
- Performance — Tells you a story over time.
- Indicator — A way to measure the impact of what’s happening.
How you use KPIs: This data tells you about your business, further, these numbers help you make decisions. These are the most important data points for your business, with this in mind, each of your KPIs should be valuable.
Here are a few examples of KPIs:
- Total sales value in the last month.
- Rate of client churn.
- Number of customers signed up to loyalty program a week.
- Amount of money in the bank.
- Profits and losses in the last month.
KPI Planning and Reporting
After identifying the KPI’s that matter to your business; plan your goals, measurements, and decision-making process. Identify your KPIs and then identify the reports you will need to measure to keep track of your KPIs.
- KPIs: The KPI that matters to your business.
- Data sources: The reports you will measure to evaluate this KPI.
- Targets: The types of targets you want to set for each of your KPIs.
- Decisions: How the report drives your business decisions.
- Timeline: Establish how often you will make data-backed decisions.
Example:
- KPI: Maintain Weekly Revenue
- Data sources: Sales Report
- Targets: $10,000
- Decisions: If revenue falls below target, increase marketing spend to drive increased traffic.
- Timeline: Track weekly sales reports and marketing spend, then reevaluate marketing spend every 2 months.
Repeat this process for your most important KPIs.
5. Decision Making
After you map out your KPIs and measurement, it’s time to kick your plan into action and begin monitoring your reports. Set time aside each week to review reports so you can begin tracking progress. While the value of keeping reports for your restaurant may not be seen immediately, as you keep up with your reports, you will be able to draw out trends, helping you make informed decisions.
If one of your KPIs is not hitting the targets established, it may be a good time to evaluate that KPI and make decisions – what can you change in order to reach your target? Is the target too high? Addressing these questions is no easy task, but with reports it is possible.
With a POS like Revel Systems, your business can easily keep track of your data, your KPIs, and make decisions to keep your restaurant on the path to success.


